When you ask a standard chatbot, "Which promotion should we run more of?", the response is immediate, confident, and frequently dangerous. It scans your data, picks the promotion with the highest average, and presents a definitive recommendation. It doesn’t pause to consider if that "winning" number is based on 10,000 orders or a single outlier. In the hands of a junior analyst—or a standard LLM—that lack of context is a recipe for strategic failure.
A human senior analyst, by contrast, operates with deliberate friction. They restate the business question to ensure alignment, form a hypothesis, write the query, and—crucially—check the statistical validity of the result before ever opening their mouth to an executive.
The gap between a chatbot and a senior analyst is not intelligence; it is discipline. In this report, we explore how to bridge that gap by moving away from single-shot prompting and toward a structured, six-stage Python toolkit that enforces analytical rigor in every AI-driven insight.
Main Facts: The "Confidence Trap" in AI Analytics
The core issue with modern LLM-based data analysis is the "confidence trap." Large Language Models are probabilistic engines designed to generate the most likely continuation of a text string, not to perform statistical validation. When an LLM performs a GROUP BY operation, it treats every group with equal weight.
In a sample dataset of 29 online orders, for instance, a naive query might show that "Promotion 4" has the highest average units sold per order. However, "Promotion 4" may only have a single recorded sale. A human analyst knows that a sample size of one is statistically insignificant, but an LLM will often treat it as a "winner" simply because the math satisfies the prompt’s condition.
To solve this, we must build a system where the AI is not just a query generator, but part of a multi-stage pipeline. By implementing a "validation gate" that forces the code to evaluate the count of observations (n_orders) against a minimum threshold, we effectively strip the AI of its ability to make reckless, low-data recommendations.
Chronology of the Pipeline: A Six-Stage Framework
To transform an LLM into a reliable analytical partner, we must break the analysis into six distinct, logical phases. This mimics the professional workflow of a seasoned data scientist.
1. Business Understanding
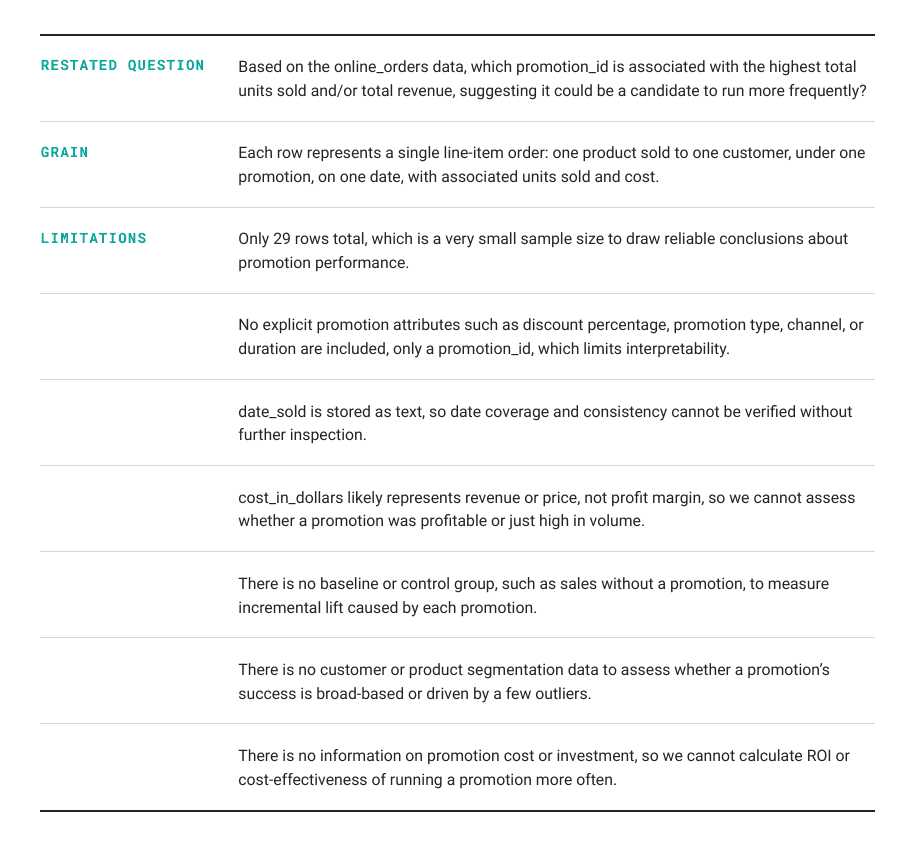
Before any code is executed, the model must restate the stakeholder’s question. This phase identifies the "grain" of the data—understanding that one row represents a single order—and highlights potential limitations like date coverage or missing dimensions. This forces the model to acknowledge what it doesn’t know before it starts "solving."
2. Hypothesis Generation
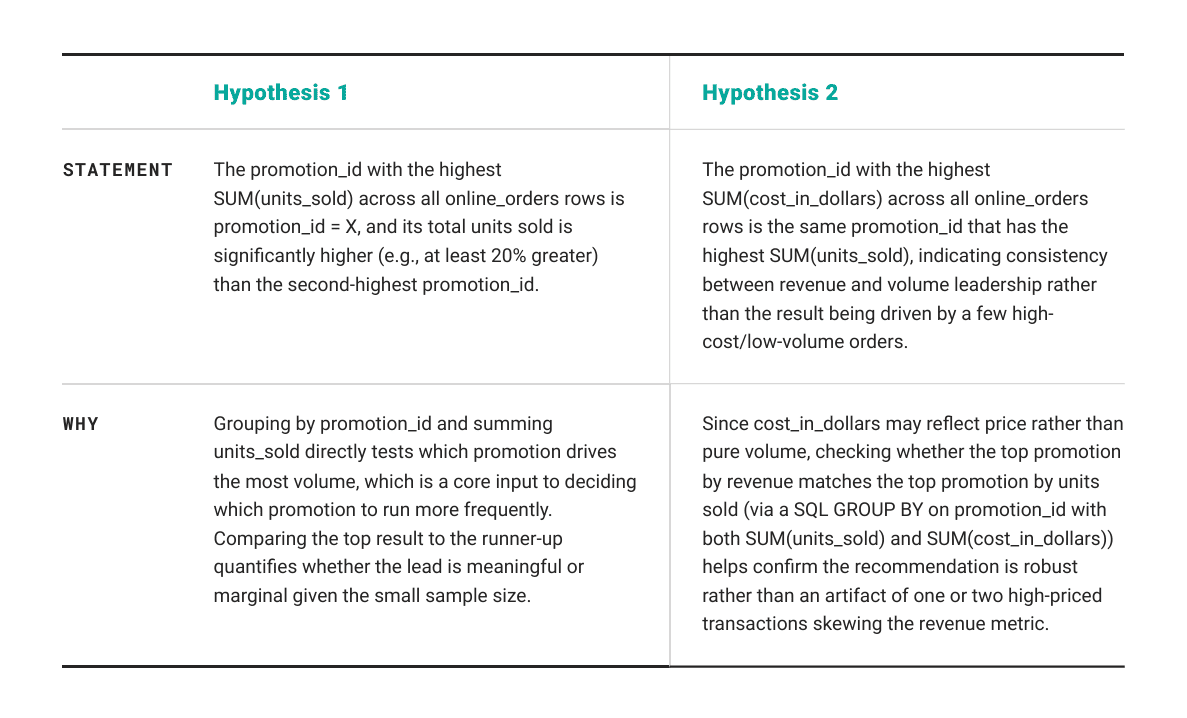
Rather than fishing for patterns, the model is instructed to propose two or three testable hypotheses. This turns the analysis from a passive search into an active investigation. By limiting the model to specific columns within the schema, we prevent it from hallucinating non-existent metrics.
3. SQL Planning
In this stage, the model translates the chosen hypothesis into a DuckDB-compatible SQL query. Crucially, the prompt requires the model to always include a COUNT(*) column. This is a non-negotiable requirement for the subsequent validation stage.
4. Validation (The "Circuit Breaker")
This is the only stage where we strip the LLM of its decision-making power. Using standard Python, the pipeline checks the query results. If the number of orders in a group falls below a pre-defined threshold (e.g., MIN_SUPPORT = 3), the pipeline tags that result as low_confidence. The AI is then explicitly prohibited from using these rows in its final recommendation.
5. Executive Summary
The model writes a summary of the findings, but it is provided with the validation results. It is instructed to ignore any low_confidence rows. This ensures that the final narrative is anchored in evidence that meets a basic standard of statistical support.

6. Recommendations
Finally, the model suggests business actions. By the time it reaches this stage, it is restricted to the facts presented in the summary, preventing it from inventing strategic justifications that the data doesn’t actually support.
Supporting Data: The Anatomy of the Toolkit
To demonstrate this, we utilize a dataset from StrataScratch containing 29 rows of order-level data. The table includes product_id, promotion_id, cost_in_dollars, customer_id, date_sold, and units_sold.
When we inspect the schema using Pandas, we find a clean but small dataset:
- Total Rows: 29
- Columns: 6
- Data Types: Integer-heavy with an object-type date column.
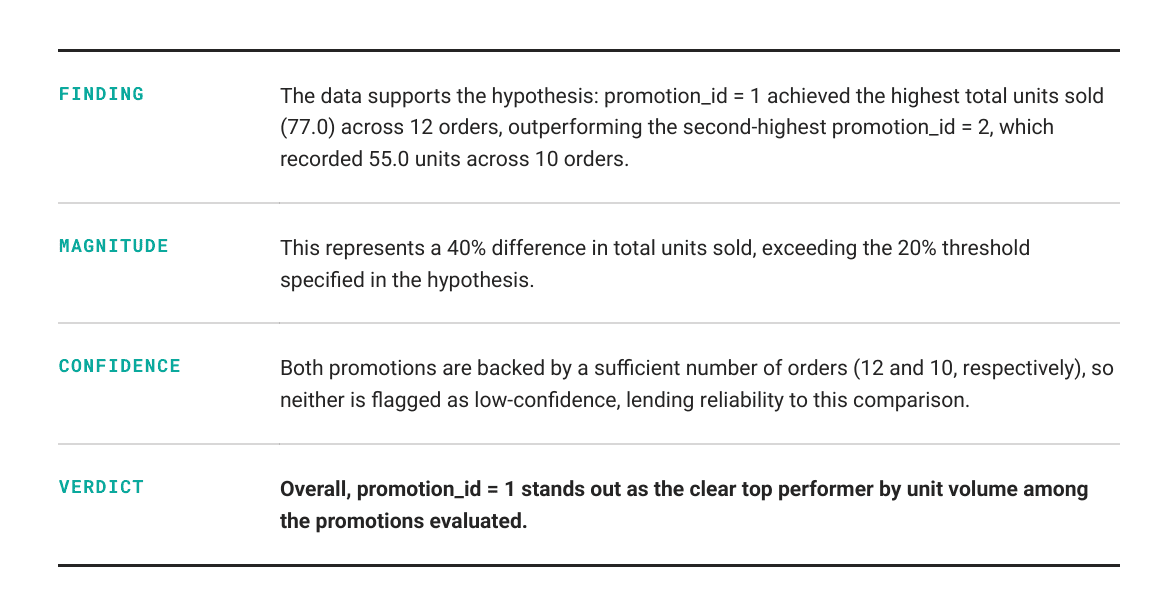
Without our six-stage pipeline, a simple SQL query ranks promotion_id 4 as the top performer with an average of 8.00 units sold. Because we have built a deterministic check into our SeniorAnalyst class, we can see that this "winner" is based on a single order. The validate() method acts as a guardrail, ensuring that the subsequent executive summary and recommendation are based on more robust groupings, such as promotion_id 1 (12 orders) or promotion_id 2 (10 orders).
Official Responses and Implementation
The technical implementation relies on a modular LLMClient wrapper. This allows the toolkit to be model-agnostic, supporting both OpenAI’s GPT-4o and Anthropic’s Claude 3.5 Sonnet. By abstracting the API calls into a complete() method, the rest of the pipeline remains focused on logic rather than provider-specific syntax.
The parser is equally critical. Since LLMs are notorious for returning text mixed with JSON, a robust parse_json utility is required. It strips markdown code fences and scans the output for valid JSON objects or arrays, ensuring the pipeline doesn’t crash due to minor formatting inconsistencies.
The Role of DuckDB
The use of DuckDB is a strategic choice. It allows us to run high-performance SQL directly against a Pandas DataFrame without the overhead of spinning up a traditional database server. This makes the entire toolkit portable, allowing it to run within a Jupyter Notebook or a local development environment.
Implications: Moving Toward "Human-in-the-Loop" AI
The implications of this approach for the broader data industry are significant. As organizations rush to integrate AI into their BI tools, they risk flooding management with "hallucinated" insights—data points that are technically correct but contextually meaningless.
1. From "Answers" to "Evidence"
By forcing the model to explain its reasoning and provide the data behind its claims, we move the focus from the answer itself to the evidence supporting it. This allows human analysts to audit the model’s logic at every step.
2. Standardization of Analysis
Because the toolkit uses a class-based structure, the same rigor is applied regardless of who runs the query. Every analysis follows the same six steps, ensuring a consistent standard of quality across an entire data team.
3. Mitigating Risk
The "validation gate" is the most important component. By defining MIN_SUPPORT as a variable, organizations can tune the sensitivity of their AI analysts. In high-stakes environments, the minimum order threshold can be increased; in exploratory environments, it can be lowered. This puts the governance of data insights back into the hands of human leadership.
Conclusion
The evolution of the AI data analyst is not about creating a "smarter" model that can guess better. It is about creating a "smarter" process that constrains the model’s natural tendency to overreach. By embedding the discipline of a senior analyst—the questioning, the hypothesis formation, and the statistical validation—into the code itself, we transform the LLM from a source of potentially misleading answers into a powerful, reliable, and transparent analytical tool.
The future of data science is not in the single prompt; it is in the pipeline. By building these guardrails, we ensure that as AI becomes more prevalent in the enterprise, it remains a tool for clarity rather than a source of confusion.